- The Evolved Investor
- Posts
- Small Cap vs. Large Cap
Small Cap vs. Large Cap
Is there a clear winner?

The Fed’s role is getting harder

The New York Times reports that the US Federal Reserve will have a more challenging time using its monetary policy tools given the uncertainty that Trump Administration policies will have on the macroeconomic environment. Namely, tariffs and mass deportations will fuel inflation while the firing of Federal employees and contractors combined with a shortage in manual labor conducted by those deported will result in a substantial decrease in economic activity.
Chair Powell stated that the prospect of rising inflation and weakening economic growth would be “a very challenging situation for any central bank.” Growth forecasts for 2025 were adjusted downward from 2.1% to 1.7% growth, an estimated reduction of $116 billion in economic activity.

=ow to think about company size when investing
Last week, we discussed how our universe for discovering value is defined at US equities, yet that is still a large range of choices, and a classic debate is whether stocks with large market capitalization (big companies) are superior or inferior investments vs. companies with smaller market capitalization (small companies). Let us explore the dynamics of each.
Large caps
Large-cap stocks are generally companies with large revenues; they are typically established brands, have large, global distribution networks, and benefit from economies of scale. Investors, including institutional investors like pension funds and asset management firms, typically like large-cap stocks because they offer stability. Large companies tend to have stronger balance sheets, generate more free cash flow, and are less likely to go bankrupt. Large established firms can use their FCF to repurchase shares or provide dividends to shareholders. This stakeholder return, the value shareholders receive in the short term through buybacks + dividends can offset the lower growth rates of these businesses. Since it’s harder to grow 20+% YOY as a $10B+ company, the investor is seeking more predictable returns, albeit with smaller growth percentages. With more established network effects and pricing power, however, these companies can grow in share price due to their ability to grow with the economy, raising prices to match inflation, holding costs lower with multi-year contracts with suppliers, etc.
Small caps
Smaller cap firms, with revenues < $100M per year and market capitalization of less than $10B, are inherently riskier as an asset class. A greater proportion of these firms may experience economic hardship during recessions and go bankrupt or get acquired for a significant discount, to the detriment of the stockholders. Balance sheets are less robust and free cash flow is usually recycled into business growth. As an asset class, there are more losers, but the winners can grow at an extraordinary rate, and the increase in future cashflows can propel the stock price way higher. The fastest-growing firms are typically going to be in the small-cap category, so by definition, if you avoid small caps altogether due to risk, you would be concentrating your portfolio in larger companies whose fastest-growing years are behind them.
So which is better?
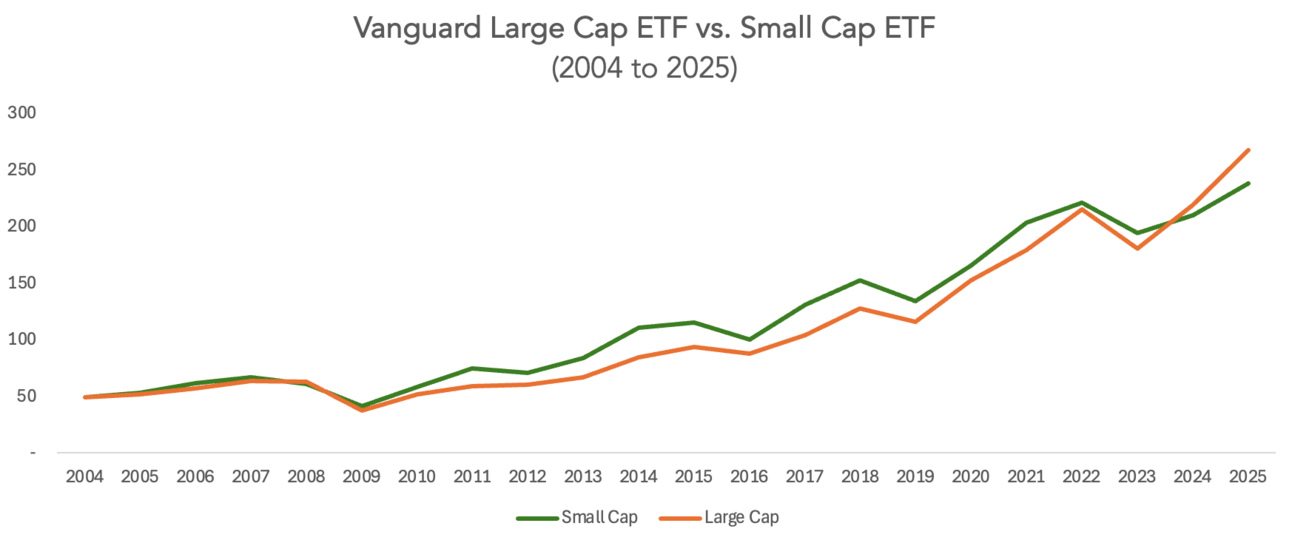
Well, that’s a more difficult question. One might think that since small-cap companies have more growth potential, on average, they would, as an overall asset class, outperform large-cap stocks. But as we can see below, that’s simply not the case. Part of the reason why is that smaller, less established firms have less pricing power. Their cost base is higher vis-à-vis larger firms. Large cap firms, but contrast, typically operate in semi-oligopolistic competition. Think Coke and Pepsi, Marriott and Hilton. The large caps have more pricing power and can negotiate lower cost structures for their operations based on their scale. This can mean that large caps can outperform small caps, especially during boom times when FCF is recycled into new revenue-generating projects at the same time as share buybacks.
The Evolved Investor
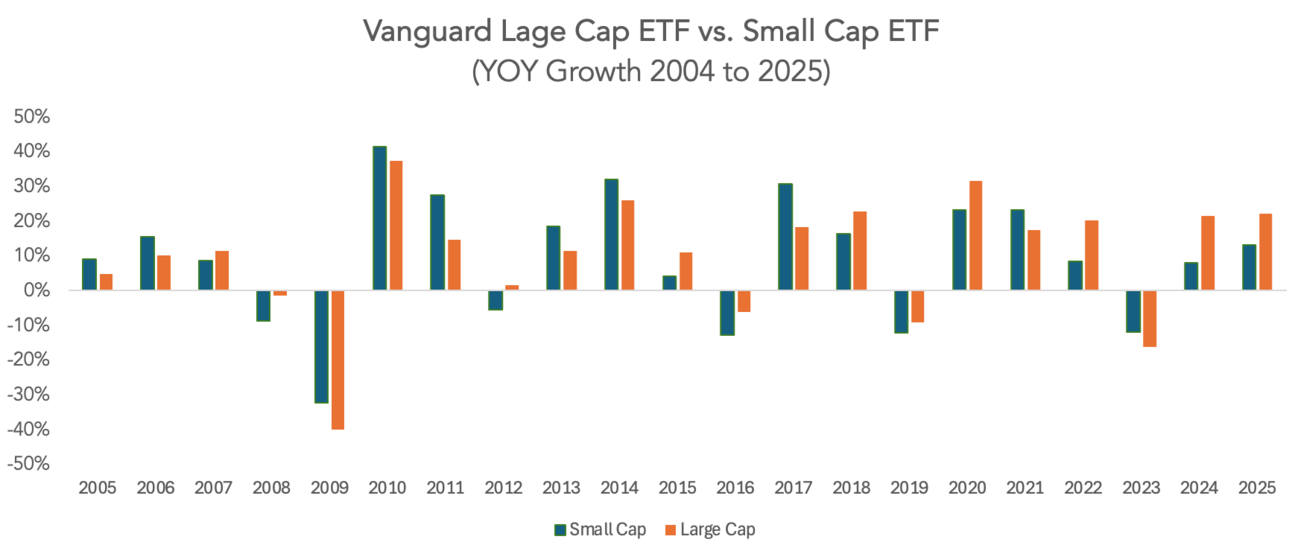
In the chart above, we see the small caps have tended to perform better over time on average up until recently, but if you look at YOY comparisons below, the results are a mixed bag, with there being no period where small caps ALWAYS outperform larger caps. Another point to note is that the CAGR for the small caps is 7.5% vs. 7.9% for the large caps, not a massive difference. A few years ago, in 2022, those CAGRs going back to 2004 would have been 8.3% for small caps vs. 8.1% for large caps, reversing the conclusion.
The Evolved Investor
In the end, the Evolved Investor is looking for value in small caps AND large caps, not small OR large. As you can see from the ETF data, incorporating too many companies spreads the risk but ensures extraordinary returns will likely not be achieved. The goal is to assess the value of the future cash flows relative to the price of the stock, then when there is a significant margin of safety, whereby the market irrationally prices the stock well below its future earnings potential, execute a trade! While the effort required to identify the small caps with the least risky business models may be higher, the reward can often be worth the squeeze.
Sponsored Post


ASML
Regarding AI hardware, the name we tend to hear the most is NVIDIA, the chip designer, however, ASML Holdings NV is a critical player in producing those chips using its proprietary extreme ultra-violet (EUV) lithography systems. It has almost monopolistic power in the space, with over 90% market share, as competitors like Canon and Nikon have failed to bring a working machine to market successfully. Chipmakers like TSMC, Samsung, and Intel rely on ASML’s lithography tools to produce the chips that power AI applications. CNBC did an in-depth profile of ASML which is worth a watch to learn a bit more about its role in the AI revolution.
Revenues have QUINTUPLED over the past decade from 5.8B euros to 28.2B euros. Although revenue growth slowed from 2023-24, profits are very strong with a gross profit margin of over 50% and a net profit margin of 26.8% (page 55). ASML has a modest dividend yield of $6.3B in free cash flow.
From a valuation perspective, the stock is 34% from its $1,110 high in July 2024 and has a PE ratio of 34.6. We would like to see the valuation come down a bit more to increase the margin of safety, but there are plenty of analysts who believe the current price is fair with a 1-year price target averaging $916 (currently $734).
Although the semiconductor market is cyclical and geopolitical risks could impact its revenues in the short term, the AI market is not going away and if the broader market continues to decline, and the stock’s price comes down a bit more as a result, ASML would be a great potential long-term play.
TEI is long ASML
Did a friend send you this newsletter? Sign up here to get weekly news and bespoke value investing content to make informed decisions about your portfolio.
Want to advertise with us? Please send us a note at [email protected]
Legal Disclaimer: The Evolved Investor is for information purposes only and is, by law, not personal investment advice. Concepts and ideas are for your consideration only. We encourage our readers to do their due diligence. Investing has inherent risk, and investments can lose value.